In this video aimed for an audience of information analysts and their management, Colin Harris presents his views on how best to apply QA, or quality assurance to data analysis.
The benefits for information analysts who use best practice techniques are achieving more correct and therefore usable results, in a shorter time period, with less rework.
This means greater productivity for everyone involved in information analysis including the decision maker or “end user” of the information.
This video discusses QA, or quality assurance, best practice for information analysts. The benefits for analysts following best practice techniques are getting better and more correct results, and improved productivity.
But first of all, a little bit of background. I am Colin Harris, Technical Director of Knoware and we are based in Wellington, New Zealand. Knoware is an analytics business intelligence and information management consultancy. We have worked with many analysts teams over many years and have seen what works well and what does not.
After many requests to provide best practice advice for analysts, we developed two half day workshop sessions – one covering non technical aspects, and the other, technical aspects.
This video covers the QA segment from the non technical workshop. To put the segment in context I will start with a workshop introduction first. When we initially put these sessions together we felt like it was a lot of common sense, and would people be gaining any valuable information from this?
What we have found after a few hundred people have been through these sessions, that by far, the majority report back that they have learnt a lot of useful information.
Even though sometimes they did already know this, but were not actually putting it in practice; they had forgotten about some of the key points. There are two clear objectives of these sessions:
(1) Getting the correct information, so the right, accurate, consistent information out, of the work that is being done; and
(2) to do the work productively or efficiently, and get good results quickly.
Here are the various segments and sections that are covered on the non technical session.
First of all we talk about some common issues and then move onto the typical project phases. We will have a quick look at that. Communications are vital to be getting the best outcomes. Some data and information management concepts, and then some general tips.
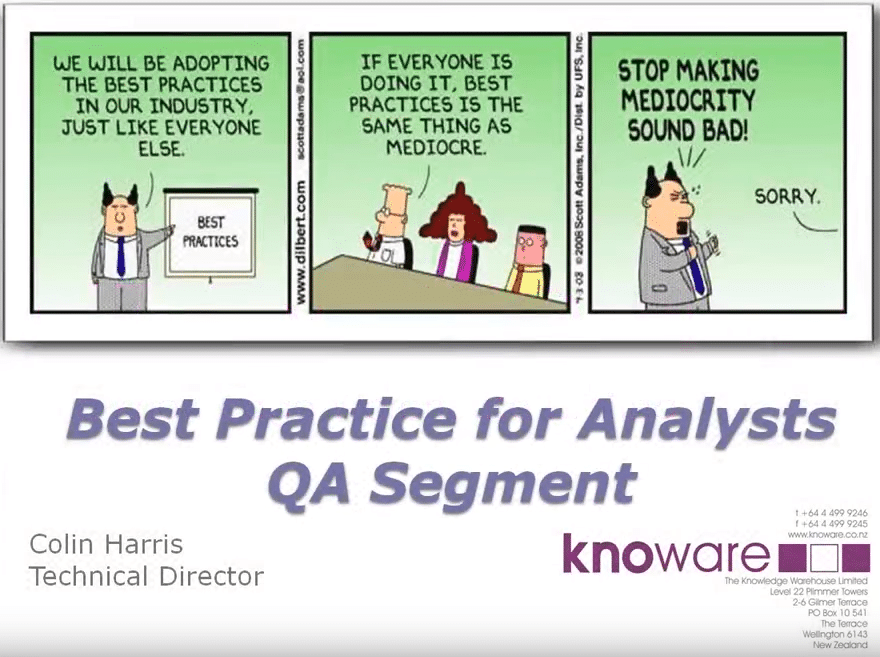
We are going to look at one part of the project phases that touch on common issues first. The common issues; we put that out to the floor and get lots of feedback and ideas of the various issues people have in their different organisations. It is amazing how similar it is across all of the different sessions – the same key issues that actually come out. I really like this Dilbert one because it is some of the key issues that do come through. Continuous changes of requirements, unclear communication – and they come out very strongly once we have put this issue out to the floor.
This slide shows typical project phases for a piece of work. It depends of course of what the work is and what the organisation is. This was one was based on research and evaluation analysts work, but it could be BI developers developing reports or user interfaces. It could be a range of different types of work that needs to be done.
They typically follow the same sort of approach. This one here, first phase there is a request for work comes in, then it goes down to someone assessing that work. It gets allocated out to the resources that are going to do the work, whether that is an individual or a whole team. Then we go down to what are the requirements of the work.
Often that is called a brief in some areas. Then looking into the background; getting some good background information before you get into the actual details of the work itself. Data exploration; another important stage to explore, look for outliers, get a good a feel of the data before going on and doing the preparation work.
The data preparation itself; then onto the actual work that is required whether that be some analysis or whether it is generating a report or something else. Once that work has been done particularly analytical type work, there is some interpretation there that adding some commentary before the results get delivered out.
Then onto QA or the quality assurance phase; that is really what we are going to be talking about in more detail in this particular video – delivering the results out and consolidation at the end. It is important to point out, the arrows that we have on the left hand side there in terms of an iterative approach is what we thoroughly recommend.
You may get down to the analysis part and then find that something is not quite right and you need to go back up to a previous phase. Whether that could be right back to adjusting requirements or back to different data preparation. It is really important to get the correct results or good results that you allow that as part of the development approach you are taking.
These days Agile is pretty popular as a formal approach but it could be all sorts of other iterative approaches that you may use to do that. So now we move onto the QA or quality assurance segment of the workshop.
And a first very important point to make is that QA should be happening throughout the whole project. Not just as a discreet step that happens near the end after the development or the analysis is done. That is an important point for us.
The second point I have there is most organisations or many organisations will have their own documentation or a methodology on how they do their QA. A lot still don’t; we are finding that is the case. The second key point down there, the bigger point is about self review. Of course as an analyst or a developer is working through doing the work they should be reviewing, testing, QA-ing their own work.
Whatever they deliver off to others to be checked out, they are confident that it is producing the right result. So is that result that you are getting as expected and how do you know what the expected result should be? That depends on the work that you are doing. You may be able to compare against other systems or other reports that have been done, or other pieces of work and at least know what the ball park numbers are going to be on the results that you are putting out there.
That last bullet point there, we say check via the source system. Often the people that we are dealing with, the analysts groups are working in a data warehouse type environment, so source systems or operational systems; the information from there is extracted into the warehouse environment and you do your analysis or your reporting from that data warehouse environment.
The results that you are getting out the other end sometimes can be good or often is good to go back to that source system, frontline system, look into that system and see what the actual real results are. The real numbers are that are coming through and check that they are coming out in your final results as well. The next major point I want to make is about peer review.
We certainly highly recommend that a peer review takes place. It happens in some organisations but many organisations it doesn’t. Someone produces results and they get sent off to whoever it is who has required those, whether it is senior manager, whether it is the customer, whether it is the public or the media.
Of course that is really dangerous if things are not checked appropriately. We would highly recommend that that is done. Other places where they say, “yeah, we do peer review” it really is lip service that is being paid and someone does a quick check and says, “hey yeah, those numbers look about right, yep put it out”.
So we would say it shouldn’t just be cursory check, it should be someone checking thoroughly and the person who is checking should know that subject matter and they should know the underlying data where it is coming from, so they can ask sensible questions, can do appropriate checks.
Another benefit out of always doing peer reviews is that it cross fertilises information between different teams or between members within the team. Because if Bob is checking what Jill has done, Bob is going to see the techniques that Jill has done and maybe learn some other things from that as well.
The next point there is about comments. This is really when people are using code based software. For example, something like SAS where you are writing an actual piece of code or programming language and it is to say that when you are commenting that logic, we think a really good guideline is if you take all the logic out and just leave the comments in there, then those comments should tell the story of the work that you are actually doing and what is actually being produced. The persons doing the peer review should not just look at the extra results coming out the end but all of the things listed there. The documentation that is being produced.
Can you follow that and understand how you should be running this logic or running this whether it is on a weekly basis or just on an adhoc basis. Look at the logic itself, the code or the program or whatever the term is that is being used. Look at any logs that are produced after running the logic.
That is really important to see if there is no stray messages coming out saying something should be looked at, whether there is an error or some note that should be reviewed to check it is producing the right results. And of course, the results themselves.
The next point is about using approved business rules. This was something that was covered earlier in the workshop about how important business rules are and that organisations should have business rules. If that is the case then part of the peer review process is that the logic is being used as a part of this piece of work, should be using the appropriate business rules. And of course if business rules don’t exist for the work that is being done, of course that can’t be done.
A good simple rule of thumb is the bottom point there that the good old ‘run over by a bus test’. If the person that developed this or produced this leaves the company or something does happen to them, can someone come along and pick up from what is left there? The documentation, the code and the folder structures that are being used; that they all make sense. That someone can pick up and do this work in the future as required.
Next slide then; not only a peer reviewer but the person who is requesting that the work is being done, whether that is them individually or someone else in their team, they of course should be checking the results also. This shouldn’t be right at the end of the process once it has all been done. The person doing the work says, “Here it is, have a look at the results”. They should be being involved throughout that as well. We talked about the iterative process earlier on. As someone as developed an initial cut or first version, should be checking themselves it is okay, get the requester or the business area who requires that information, to have a look and say this is our preliminary results. How does that look? Now is it laid out appropriately? Is it the sort of numbers you are looking at? So you know when you get through to the final result that you should be on track and delivering what needs to be delivered.
The next point there is about a formal sign off process. Often this is skipped over particularly for smaller pieces of work. We have seen people bitten on the backside by that happening a number of times. The recommendation there is to always have some sort of formal sign off process. If it is a small piece of work it doesn’t have to be huge in terms of the sign off process. It can just be a matter of saying to the person or the business unit that has got the information, “Is that what you are after, is that correct?” and if it is, to put an email through to say, “Yes I agree; I have got the results I want, thanks”.
Rather than saying verbally that and that is a bit hard to protect yourself further down the track. That person leaves and you have got no record that you had produced the correct results. As the note says there, it depends on the size or the importance of the work as to how formal you get in the sign off, so it ranges from a simple email right through to a much more detailed document where you have got test results and sign offs for the results or work through that particular document.
The last point we have there for this little segment is ongoing validation. It is something that a lot of people don’t think about. You have created the first piece of work. You have checked it out. It delivers the results. It is peer reviewed, it is all great and that is really good. But if this is something that is done regularly, weekly reporting or monthly, or quarterly or whatever, there should really be something put in place that validates this on an ongoing basis. So maybe once a quarter or once every six months someone should go and check that those results are still returning valid results.
The best way to do that is as the original piece of work is done, you are of course testing that the results are correct and as part of that testing, building up a little report suite that does the validation or the data quality checking. It is not just for that initial testing, but put that to one side as a little suite that can be run in six months time and that is run through and cross checks back against some other numbers; or produces some numbers that you need to manually check.
Then you can continue to say great, this is producing our correct results. It is also really useful for troubleshooting. If someone says, “hey the numbers are wrong, don’t trust these numbers” or something really weird does come out, there is a number that obviously ten times too big that has come through because data changes over time, that checking suite of logic or programs can be used very nicely to help troubleshoot and identify where an issue is actually coming from.
If you are interested in us doing more of these sorts of videos from other sections of these best practice workshops we have put together, please contact us, let us know and we will certainly consider putting the other sections up as part of some videos for you to review.
Thanks for listening.


